Ghana Data Commons

Ghana's open environmental dataset

Collected by university interns under professional supervision, published freely for communities, planners, researchers and donors. Every restored site adds a permanent before/after record.

About the Data Commons

The environmental data Ghana has never had

GIS map showing community data layers across an African city

No systematic, open, community-level environmental dataset exists for Ghana's towns and cities. District Assemblies make planning decisions without knowing where their dump sites are. Development organisations fund projects without knowing where sanitation fails. Researchers study urban environments without access to ground-truth data.

Ghana Data Commons changes that. Using free open-source tools, KoboToolbox for data collection, ODK Collect for field surveys, and OpenStreetMap for mapping, GreenPulse Ghana trains and deploys university interns to systematically collect 13 layers of environmental and community data across Ghanaian towns. All data is quality-checked, formatted and published openly. No paywalls. No restrictions. Ghana's environmental data belongs to Ghana.

What we map

What data is collected and mapped across Ghana

GreenPulse Ghana builds data in three progressive tiers, from basic ground truth through to predictive planning. Click each tier to explore what is collected and why it matters.

01 Foundational Data Basic inventory and service presence: what is there, what is missing, what works

The basic ground truth that communities, District Assemblies and development organisations in Ghana currently lack. Before anything else can be understood, this data must exist.

Waste & Sanitation

  • Where are dump sites and waste accumulation points?
  • Where are blocked drains and choked gutters?
  • Where are areas of open defecation?

Water Supply

  • Which communities depend on streams, rivers, or unsafe water sources?
  • Which boreholes are functional, and which are broken or seasonal?
  • Which schools and clinics lack reliable water supply?

Education Facilities

  • Which schools have toilets, and which do not?
  • Which schools lack handwashing facilities?
  • Which schools are overcrowded or lack classrooms and basic equipment?

Health Services

  • Which communities are far from the nearest clinic or hospital?
  • Which facilities are closed, understaffed, or under-equipped?
  • Which facilities lack water, electricity, or sanitation?

Roads, Transport & Mobility

  • Which roads are impassable during the rainy season?
  • Which settlements become cut off during floods?
  • Where are dangerous intersections and crash hotspots?

Drainage, Flooding & Environmental Risks

  • Where do communities flood?
  • Which homes, schools, clinics, and markets flood repeatedly?
  • Where are wetlands and waterways being encroached upon?

Energy & Public Lighting

  • Where is there no street lighting?
  • Which neighbourhoods lack electricity access?
  • Which streetlights are installed but not working?

Land Use & Settlement Conditions

  • Where are informal settlements expanding?
  • Where are structures built on waterways, road reserves, or public land?
  • Which areas have no updated land use records?

Public Services & Community Infrastructure

  • Where are markets, community centres, police posts, and emergency response points?
  • Which public facilities exist on paper but are not functioning in reality?
  • Which facilities need urgent repair, rehabilitation, or replacement?
02 Intermediate Data Condition, access, performance and patterns: how well does it work, who can access it, what patterns are emerging

Building on foundation data, intermediate data goes beyond "where is it?" to ask "how well does it function, who can actually reach it, and what patterns of failure or pressure are emerging?"

Infrastructure Condition & Service Quality

  • What is the physical condition of roads, drains, schools, toilets, clinics, and water points?
  • How often do boreholes break down?
  • How reliable is pipe-borne water delivery?
  • How often is waste collected in each area?
  • How often do power outages occur in specific neighbourhoods?
  • What is the capacity of drainage systems compared to actual runoff?

Accessibility & Travel Time

  • How long does it take residents to walk to the nearest school, clinic, market, or water source?
  • Which neighbourhoods are beyond acceptable travel time to health care?
  • Which roads become inaccessible seasonally?
  • How long does it take emergency services to reach flood-prone communities?
  • Which areas are underserved when travel time, not just distance, is considered?

Usage & Demand Patterns

  • How many people use each borehole, clinic, school, or toilet facility?
  • Which roads carry the most traffic at different times of day?
  • Which waste sites receive the highest waste volumes?
  • Which schools are over capacity compared to enrolment?
  • Which clinics experience the highest patient loads?

Population–Service Relationships

  • Which areas have the highest population relative to available services?
  • Which settlements have rapid population growth but no matching infrastructure growth?
  • What is the ratio of toilets, classrooms, nurses, or water points to population?
  • Which communities have the highest unmet service demand?

Seasonal & Recurring Problem Data

  • Which roads consistently fail during rainy seasons?
  • Which communities flood every year, and how often?
  • Which water points dry up seasonally?
  • Where do disease outbreaks rise during certain seasons?
  • Which drainage channels overflow repeatedly?

Land & Development Dynamics

  • Where is settlement expansion happening fastest?
  • Which agricultural lands are being converted to housing?
  • Where is informal construction increasing?
  • Which zones are under pressure from rapid urban growth?
  • Where are encroachments becoming more frequent?

Social & Vulnerability Profiling

  • Which neighbourhoods have high concentrations of low-income households?
  • Which communities contain many elderly residents, children, or persons with disabilities?
  • Which areas combine several disadvantages at once, flood exposure, poor sanitation, long travel times, and weak services?
  • Which areas are socially vulnerable even if they are not physically remote?
03 Advanced Data Predictive, integrated and decision-modeling data: what will happen next, and where should action be prioritised first

Advanced data is used for forecasting, simulation, investment targeting and long-term strategy. It goes beyond describing current conditions to answer: what will happen next, and where should limited resources go first?

Predictive Risk Modelling

  • Which communities are most likely to flood under different rainfall scenarios?
  • Which roads are most likely to fail in future rainy seasons?
  • Which areas are at greatest risk of future disease outbreaks linked to water and sanitation?
  • Which informal settlements are most likely to expand into hazardous land?
  • Which neighbourhoods are most vulnerable to climate-related shocks?

Suitability & Scenario Analysis

  • Which lands are most suitable for future housing development?
  • Which locations are best for new clinics, schools, transfer stations, or public toilets?
  • Which routes would be most efficient for waste collection expansion?
  • Where should drainage investment happen first for greatest impact?
  • What happens if the city expands in one direction instead of another?

Network & Systems Analysis

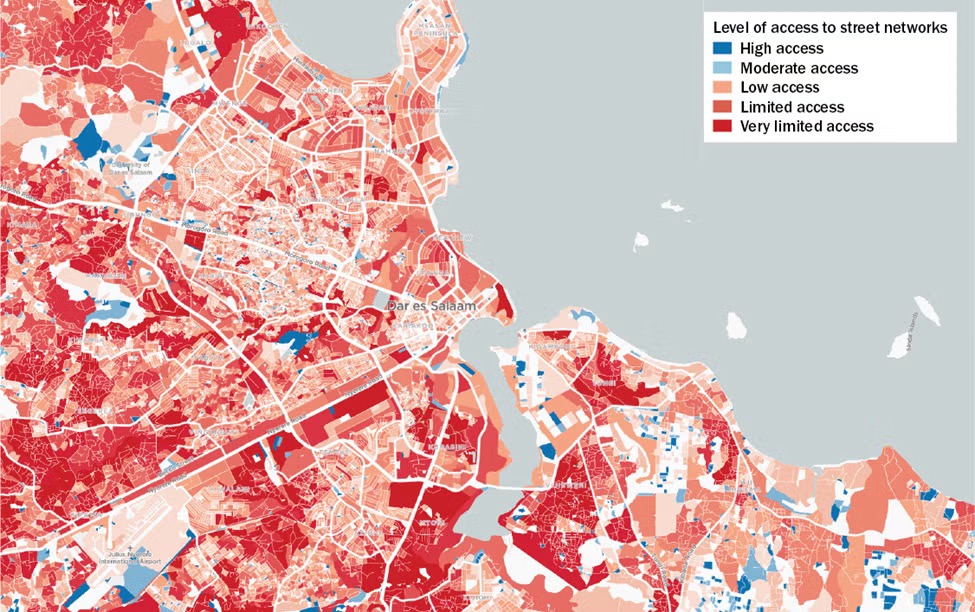
  • How efficiently does the road network connect communities to jobs and services?
  • Where are the critical failure points in water, electricity, drainage, or transport systems?
  • Which infrastructure upgrades would benefit the highest number of people?
  • How do failures in one service affect others, such as flooding damaging roads and blocking clinic access?

Real-Time & Near-Real-Time Monitoring

  • Live flood level monitoring in high-risk drainage zones
  • Sensor-based water point and borehole monitoring
  • Smart waste collection tracking and route optimisation
  • Real-time infrastructure fault reporting from communities
  • Ongoing monitoring of air quality, heat exposure, or pollution

Investment Prioritisation & Cost–Impact Analysis

  • Which intervention gives the greatest benefit per cedi spent?
  • Which communities should be prioritised first for roads, drainage, or water?
  • What is the estimated cost of closing service gaps by district or neighbourhood?
  • Which projects provide the highest reduction in vulnerability?
  • Where can limited budgets achieve the greatest public health or mobility gains?

Urban Growth Forecasting

  • Where will settlement growth likely occur in the next 5–10 years?
  • Which peri-urban areas are likely to urbanise rapidly?
  • Where will future demand for schools, clinics, roads, and water be highest?
  • Which environmental assets are most at risk from urban expansion?

Integrated Decision-Support

  • Combining land use, flood risk, poverty, infrastructure, mobility, and demographic data into one planning model
  • Creating service gap indices by community and district
  • Creating urban vulnerability and deprivation maps
  • Building dashboards for District Assemblies, NGOs, and ministries
  • Using multi-criteria analysis to decide where to invest first
Collection methodology

How the data is collected

GreenPulse Ghana partners with Ghanaian universities to recruit and train environmental science, geography and planning students as field data collectors. Each intern cohort receives structured training in the use of KoboToolbox and ODK Collect for data entry, GPS mapping protocols, photographic documentation standards, and community engagement ethics. Data is collected in the field using smartphones, automatically uploaded to secure servers, quality-checked by the GreenPulse Ghana team, and published to OpenStreetMap and our own open data portal.

The internship model serves two purposes simultaneously: it produces high-quality community data at low cost, and it provides Ghanaian planning and geography students with professional field experience that prepares them for careers in urban planning, environmental management and development practice.

Data users

Who uses the Ghana Data Commons

District Assemblies

Planning officers use dump site locations, road conditions and sanitation data to prioritise infrastructure budgets and development decisions.

Researchers and universities

Academic researchers in Ghana and internationally use the dataset as ground-truth community data for urban planning, public health and environmental studies.

NGOs and donors

Development organisations use baseline survey data to design programmes, write grant applications and measure impact over time.

Communities

Community members and local leaders use the published maps to advocate for services, report environmental hazards and track the improvement of their own neighbourhoods.

Fund a data collection day

GHS 250 funds one full day of university intern field data collection.

Support our work →